Abdallah A Mahjoub1 ![]() ,
Amer H Khan1,
Syed A Syed Sulaiman1,
Razak Lajis2,
Che N Man2,
Irfhan A Hyder Ali3
,
Amer H Khan1,
Syed A Syed Sulaiman1,
Razak Lajis2,
Che N Man2,
Irfhan A Hyder Ali3
For correspondence:- Abdallah Mahjoub Email: a_almahjoob@yahoo.com Tel:+60176883570
Received: 15 April 2016 Accepted: 6 October 2016 Published: 29 November 2016
Citation: Mahjoub AA, Khan AH, Sulaiman SA, Lajis R, Man CN, Ali IA. Simultaneous determination of isoniazid and pyrazinamide in plasma by high performance liquid chromatography. Trop J Pharm Res 2016; 15(11):2475-2481 doi: 10.4314/tjpr.v15i11.24
© 2016 The authors.
This is an Open Access article that uses a funding model which does not charge readers or their institutions for access and distributed under the terms of the Creative Commons Attribution License (http://creativecommons.org/licenses/by/4.0) and the Budapest Open Access Initiative (http://www.budapestopenaccessinitiative.org/read), which permit unrestricted use, distribution, and reproduction in any medium, provided the original work is properly credited..
Purpose: To develop and validate a new high performance liquid chromatographic (HPLC) method for the simultaneous determination of isoniazid (INH) and pyrazinamide (PZA) in plasma.
Methods: A 150 µL aliquot of plasma was mixed with 75 µL of 10 % trichloroacetic acid containing 100 mg/L of acetanilide as the internal standard (IS). After vortex mixing and centrifugation, 100 µL of the supernatant was reacted with 20 µL of 0.1 % trans-cinnamaldehyde for 10 min, and then 40 µL of 1M ammonium acetate was added. Finally, 20 µL was injected into the HPLC system. HPLC analysis was performed on reversed phase C18 column. The initial composition of the mobile phase was 4 % acetonitrile, and 96 % of 20 mM 1-hexane sulfonic acid (PH 2.7) delivered at a flow rate 1 mL/min.
Results: All calibration curves were linear (r2 > 0.997). The method was accurate, and relative error (RE) was < 4.5 % for both drugs. Intra-day and inter-day precision was good for both drugs, with the highest relative standard deviation (RSD) being 8.51 %. The lower limit of quantification was 0.60 mg/L for isoniazid and 3.00 mg/L for pyrazinamide.
Conclusion: The method proposed here is precise, accurate, fast, simple and suitable for therapeutic drug monitoring of INH and PZA simultaneously.
Introduction
Isoniazid (INH), rifampicin (RIF), and pyrazinamide (PZA) are the mainstay drugs in the treatment of tuberculosis (TB). Isoniazid is the most powerful anti-tuberculosis agent against the rapidly dividing organism because it possesses the highest early bactericidal activity (EBA) [1,2]. Although pyrazinamide has no or little EBA, it has a high-sterilizing activity [2]. PZA is particularly effective against the Mycobacterium tuberculosis in the area of necrosis, where acidic media are available. In vitro studies show that both PZA and INH exhibit a concentration-dependent effect [3,4]. Poor patient outcomes were associated with low levels of INH or PZA [5-7]. Thus, individualization of INH and PZA doses based on their blood concentration could be helpful in optimizing the drug therapy for some patients with poor response.
Several HPLC methods for the determination of one or more of the antituberculosis drugs in plasma or serum are available [8-13]. Some of these methods are developed for determining INH alone or with its major metabolites [8-11]; as a result, these methods cannot be applied for determination of PZA. HPLC methods for simultaneous determination of INH, PZA, and RIF are also available [12,13]. In the present work, we describe a new HPLC method with UV detection for simultaneous determination of INH and PZA in plasma. The advantages of this method include the following: (1) a small volume of plasma is required; (2) sample pretreatment is simple; (3) the method is time efficient because the drying and reconstitution steps are omitted, and HPLC run time is short; and (4) simultaneous determination of INH and PZA is accomplished. This method is proven to be simple, fast, selective, accurate, and precise and was successfully applied for the determination of INH and PZA plasma concentrations in pulmonary TB patients.
Methods
Reagents and chemicals
Reagents with high purities were purchased from well-established and global suppliers to ensure accurate and precise results in the present study. INH, PZA acetanilide, trans-cinnamaldehyde, ammonium acetate, and trichloroacetic acid (TCA) were purchased from Sigma-Aldrich (Germany). The purity of all of these chemicals was above 99 %. HPLC-grade 1-hexane sulfonic acid sodium salt was purchased from Fisher Scientific (UK). HPLC-grade acetonitrile was purchased from J.T. Baker (China). Deionized water was obtained from Direct-Q UV3 (Millipore, France). A stock solution of 0.1 % trans-cinnamaldehyde was prepared by diluting the pure trans-cinnamaldehyde in methanol.
Chromatography
The HPLC system consists of 1525 binary pumps (Waters), 2489 UV/Visible detector (Waters), 7125 Rheodyne Manuel injector, which were connected by 20 µL stainless steel tubes to Zorbax Eclipse Plus C18 column (150 × 4.6 mm, 5 µm particle size) equipped with Zorbax C18 guard column. The mobile phase consists of HPLC grade acetonitrile as solvent A and 20 mM 1-hexane sulfonic acid sodium salt (pH 2.7, adjusted with 10 % ortho-phosphoric acid) as solvent B.
The mobile phase was delivered as gradient elution, which started as 4 % solvent A and 96 % solvent B at a flow rate of 1 mL/min, for the first 4.5 min. Then, the percentage of acetonitrile and the flow rate were increased linearly to reach 35 % and 1.5 mL/min respectively, by 5.5 min. This later setting was held until 8.5 min. After that, the percentage of acetonitrile was further increased linearly to reach 50 % by 9.5 min. Finally, acetonitrile percentage and the flow rate were decreased linearly to reach the initial setting by 10 min and were kept stable to the end of the run at 13 min. The volume of injection was 20 µL. By programming the timed-event feature of the detector, which allows changing the wave lengths, the signals were monitored at 269, 254 and 340 nm for PZA, acetanilide and INH trans-cinnamaldehyde derivative respectively.
Preparation of standards and quality control samples
Stock solutions of INH, PZA and acetanilide were prepared in purified water at concentration of 1 g/L. These stock solutions were kept in amber glass bottles and stored at −20 °C. Calibration standards (CS) of 3, 10, 20, 30, 60, 75 mg/L of PZA and 0.6, 2, 4, 6, 12, 15 mg/L of INH were prepared in a volumetric flask by spiking blank human plasma with an appropriate amount of the stock solutions. Quality control samples (QCS) were prepared by spiking the blank human plasma with the appropriate amount of the stock solutions of PZA and INH to produce QCS of low concentration (8 mg/L PZA and 1.6 mg/L INH), middle concentration (35 mg/L PZA and 7 mg/L INH), and high concentration (70 mg/L PZA and 14 mg/L INH). Acetanilide as internal standard (IS) was prepared at 100 mg/L concentration in 10 % TCA.
Sample preparation
One hundred and fifty micro-liter (150 µL) of plasma was placed in 1.5 mL microcentrifuge tube, and 75 µL of 100 mg/L of IS in 10 % TCA was added. After mixing on a vortex shaker for 20 s, the mixture was centrifuged at 3000 rpm for 7 min. To a 100 µL aliquot of the supernatant, 20 µL of 0.1 % trans-cinnamaldehyde in methanol was added and left for 10 min. Then, 40 µL of 1 M ammonium acetate was added to neutralize pH. Finally, 20 µL solution was injected into the HPLC system.
Method validation
Selectivity: Selectivity of the method was assessed by analyzing six different batches of pooled human plasma.
Calibration curves: For INH, the calibration curve was constructed by plotting the ratio of peak height of INH to the peak height of IS (y-axis) against the nominal concentrations of the six INH CS (x-axis). For PZA, the calibration curve was constructed by plotting the ratio of peak area of PZA to the peak area of IS (y-axis) against the nominal concentrations of the six PZA CS (x-axis). Least square linear regression was employed to generate the calibration equations and the correlation coefficients.
Limit of detection (LOD) and of lower limit of quantification (LLOQ): LOD was defined as the lowest concentration with a signal-to-noise (S/N) ratio of at least 3. LLOQ was defined as the lowest concentration on the calibration curve with at least five times greater response than that of blank plasma, a precision of < 20 % and accuracy within ± 20 %.
Accuracy and precision: The three QCS and the LLOQ for each drug were injected five times daily to assess the accuracy and intra-day precision. This process was repeated for three consecutive days to assess the inter-day precision and accuracy. Accuracy was measured as the relative error (RE, %), and precision was measured as the relative standard deviation (RSD, %).
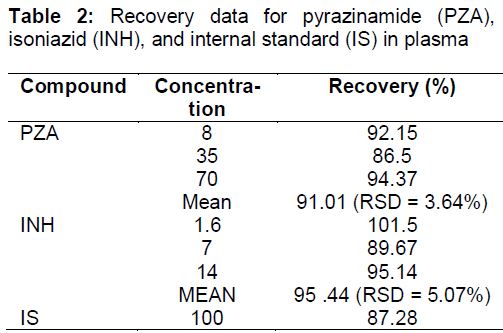
Recovery: Recovery was assessed by comparing the peak's area of the three QCS of PZA in the plasma, with their corresponding concentration in the post-extracted plasma. Recovery of INH was assessed by comparing the peak's height of the three QCS in the plasma with their corresponding concentration in the post-extracted plasma. Recovery of the IS was assessed by comparing its peak's area at 100 mg/L concentration spiked in the plasma with the same concentration spiked in post-extracted plasma. Five replicates of each concentration were conducted.
Ethical approval
Before the application of this method to TB patients, ethical approval was obtained from the Medical Research and Ethic Committee (MREC), Ministry of Health Malaysia (approval ref no. KKM/NIHSEC/P11-569). The study was conducted in compliance with the Declaration of Helsinki [14]. Every enrolled patient was given an informed consent form written in either Malay language or English languages. The patients had to sign the informed consent form, in order to be accepted in the study. Verbal clarification was given to any patient according to their wishes.
Results
Chromatographic data
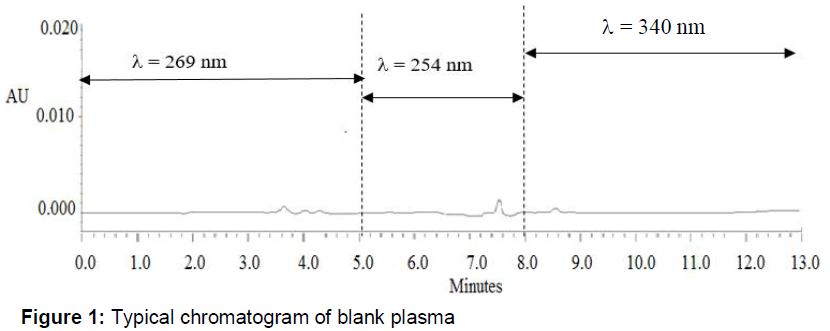
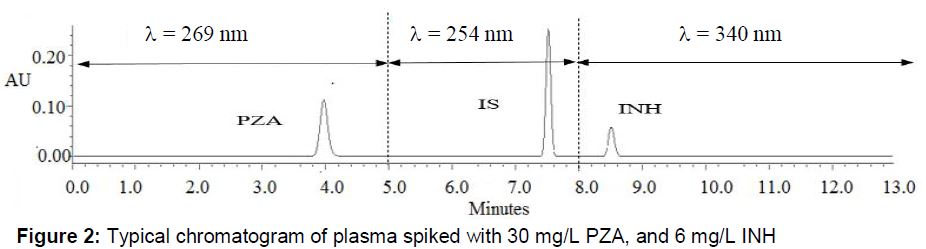
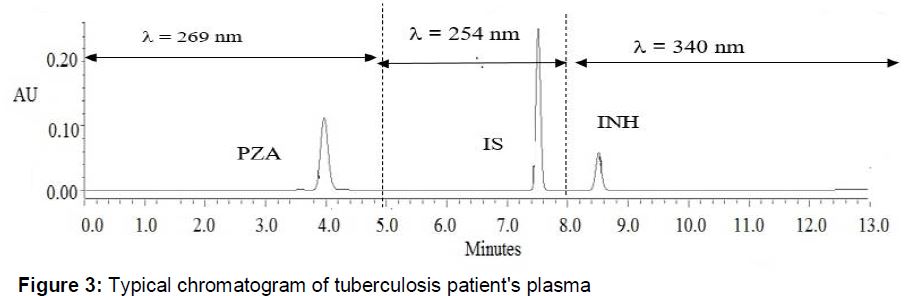
Under the programmatic gradient elution described previously, when the acetonitrile percentage was kept at 4 %, PZA eluted at 4 min. The retention time of PZA could be shortened by increasing the percentage of acetonitrile in the mobile phase. However, we found that, this composition is the optimum, considering peak symmetry and peak area. By increasing the percentage of acetonitrile in the mobile phase, acetanilide, and INH trans-cinnamaldehyde derivative eluted at approximately 7.5 and 8.5 min, respectively. The chromatogram of blank plasma (), plasma spiked with the specific concentrations of PZA () and INH (), and plasma from TB patients () are provided.
Method validation
For method selectivity, the six different batches of human plasma did not exhibit any interfering peaks at, or close to, the retention time of PZA, IS, or INH.
The calibration equation of the calibration curves of PZA in the range of 3 mg/L to 75 mg/L was y = (0.041 ± 0.005) x + (0.009 ± 0.009), r2 = (0.999 ± 0.00) (n = 3). The calibration equation of the calibration curves of INH in the range of 0.6 mg/L to 15 mg/L was y = (0.063± 0.006) x + (0.0096 ± 0.003), r2 = (0.9986 ± 0.0005) (n = 3).
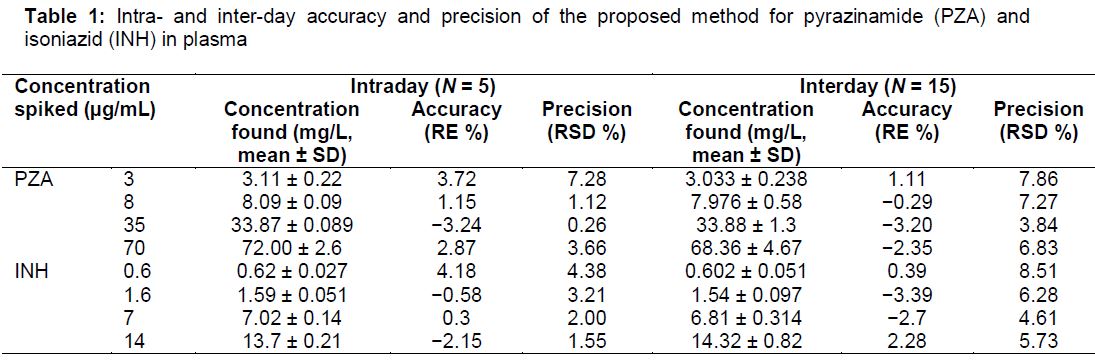
The deviation of all CS used in constructing the calibration curves for INH or PZA from their nominal concentration was < 15 %. The LOD was 1 mg/L for PZA and 0.25 mg/L for INH. The LLOQ was set at 3 mg/L for PZA and 0.6 mg/L for INH. The intraday and interday results show good accuracy and precision for PZA and INH. For PZA, intraday and interday accuracy (RE, %) were between −3.2 % and 3.7 % and between −3.2 % and 1.1 %, respectively; meanwhile, its intraday and interday precision (RSD, %) were not more than 7.3 % and not more than 7.9 %, respectively. For INH, intraday and interday accuracy (RE, %) were from −2.1 % to 4.2 % and from −3.4 % to 2.3 %, respectively; meanwhile, its intraday and interday precision (RSD, %) were not more than 4.38 % and not more than 8.5 %, respectively ().
The average recoveries of PZA and INH were 91 % (RSD, 3.64 %) and 96.28 % (RSD, 5.4 %), respectively. Meanwhile, the recovery of IS was 87.3 % ().
Application of the method to TB patients
The method was applied to determine the plasma concentrations of INH and PZA in 25 HIV-negative, pulmonary TB patients treated in Hospital Pulau Pinang, Malaysia. All patients were in the intensive phase of therapy. Drugs were given in doses based on the body weight of the patients. Five blood samples were collected from each patient in evacuated blood collection tubes containing ethylenediaminetetraacetic acid (EDTA) at 0.5, 1, 2, 3, and 4 h after witnessed administration of anti-TB agents. Plasma was separated immediately and stored in the freezer at −20 °C until the analysis. A wide variation in maximum blood concentrations (Cmax) of INH and PZA, as well as time to reach Cmax (Tmax), was observed.
The maximum INH concentration was in the range of 1.6 mg/L to 11.7 mg/L (5.7 ± 2.76). Compared with the published reference range [15] of 3 mg/L to 6 mg/L, 11 patients (44 %) had high INH concentration, 10 patients (40 %) had normal INH concentration, and 4 patients (16 %) had low INH concentration.
PZA Cmax was in the range of 29.3 mg/L to 71.4 mg/L (49.1 ± 13.2). Compared with the published reference range [15] of 20 - 60 mg/L, 18 patients (72 %) had normal PZA concentration and 7 patients (28 %) had high PZA concentration. No patient had low PZA concentration. The median Tmax was 1 h for INH and PZA.
Discussion
During the development of this method, various chemical buffers at different concentrations and different pH ranges have been considered. However, PZA peak was best separated and resolved with the use of 1-hexane sulfonic acid sodium salt at 20 mM concentration and 2.7 pH adjusted with 10 % ortho-phosphoric acid. TCA was selected for plasma protein precipitation because the coupling reaction of INH with trans-cinnamaldehyde requires an acidic medium [10,11,16]. In addition, PZA recovery was higher with TCA than with organic protein precipitants, such as acetonitrile or methanol. The ratio of TCA to plasma was selected to be 0.5:1 because it is the lowest ratio that yields maximum protein precipitation and minimum dilution of target compounds in supernatant [17]. TCA was used to precipitate plasma proteins in 10 % to 30 % (w/v) concentration. In this method, no differences between these concentrations were observed; thus, the lowest concentration (10 %) was selected. CS choices for INH and PZA were made based on their ranges in TB patients found in other studies [5–7,18,19]. QCS concentrations were selected based on the recommendations of the FDA guideline for bioanalytical method validation [20]. The guideline recommends the use of three different concentrations as QCS. The low-concentration QCS should be within three times the LLOQ. The middle-concentration QCS should be in the midrange of the calibration curve. The high-concentration QCS should approach the upper limit of the calibration curve.
The coupling reaction of INH with trans-cinnamaldehyde to produce a derivative with maximum UV absorption at 340 nm was first used by Eidus and Harnanansingh [16] in a spectrophotometric method. This chemical reaction was used in other HPLC methods [10,11]. However, all of these methods were developed for the quantification of INH alone or with its metabolites, and none of them can be used for the determination of PZA. Our method is suitable for the simultaneous determination of INH and PZA with a few simple steps of plasma pretreatment and short running time. These two advantages make this method suitable for the analysis of a large number of samples.
The maximum INH and PZA plasma concentrations obtained in this study were consistent with the results of other studies. McIlleron et al [18] reported that the median Cmax of INH was 6.5 mg/L, and only 2 % of 142 patients had Cmax of INH level less than 3 mg/L. The median Cmax of PZA was 52.7 mg/L, and only one patient (0.7 %) had Cmax of PZA less than 20 mg/L. Vij et al [19] determined that the mean Cmax of INH was 6.9 mg/L in 10 patients with pulmonary TB, whereas the mean Cmax of PZA was 26.7 mg/L. Chideya et al [5] observed that 37 and 5 % of patients had low concentrations of INH and PZA respectively. The high proportion of patients with low INH concentration in their study may be attributed to the fact that most of the patients included were HIV-positive. In addition, in their study, blood samples were collected at 1, 2 and 6 h after drug ingestion. In our study, 0.5 h was the most common Tmax for INH and PZA. In fact, a low INH concentration is common in studies that rely on one blood sample. For instance, Ray et al [21] reported that INH concentration in 2 h post-dose samples taken from 90 patients was below the reference range in 48 % of the patients. Moussa et al [11] determined that the INH concentration in 3 h post-dose samples was below the reference range in 54 % of 13 TB patients. Our results, together with the results of other studies [18,19], indicate the importance of analyzing a series of blood samples to obtain the maximum blood concentrations of INH and PZA. Relying on one sample taken at a specific time, such as the 2 or 3 h post dose, is likely to yield a false high percentage of patients with low levels of these drugs, particularly INH.
Conclusion
The proposed method is selective, precise, accurate, fast, simple and suitable for application in the simultaneous therapeutic drug monitoring of INH and PZA. A series of blood samples is required to measure the Cmax of INH and PZA accurately for clinical decision making because the Tmax of these drugs shows a wide variation among TB patients.
Declarations
Acknowledgement
References
Archives


News Updates